Imagine you're trying to navigate a city the size of Paris or London, but someone handed you only a list of street names.
No map. No landmarks. No sense of which roads connect to which neighborhoods.
Until very recently, that was the situation for anyone trying to understand human microbiome metabolism computationally. We had the data. We had the models. We had hundreds of thousands of genome-scale metabolic reconstructions describing the biochemistry of individual gut microbes in extraordinary mathematical detail. But we had no way to see any of it. No visual layer. No atlas. Today, we can!
What Is Microbiome Metabolism and Why Should You Care?
The microbiome is the community of microorganisms (bacteria, fungi, and viruses) that live in or on a particular part of the body. We tend to consider microbes as pathogens - things that are dangerous and need to be destroyed. But the truth is, most of the microorganisms that colonize us are commensal. This means they live off our waste without causing harm, and many are actively beneficial to us! In fact, it is a mutually beneficial co-existence: the human body serves as a host to microorganisms and the communication and balance between them are key.
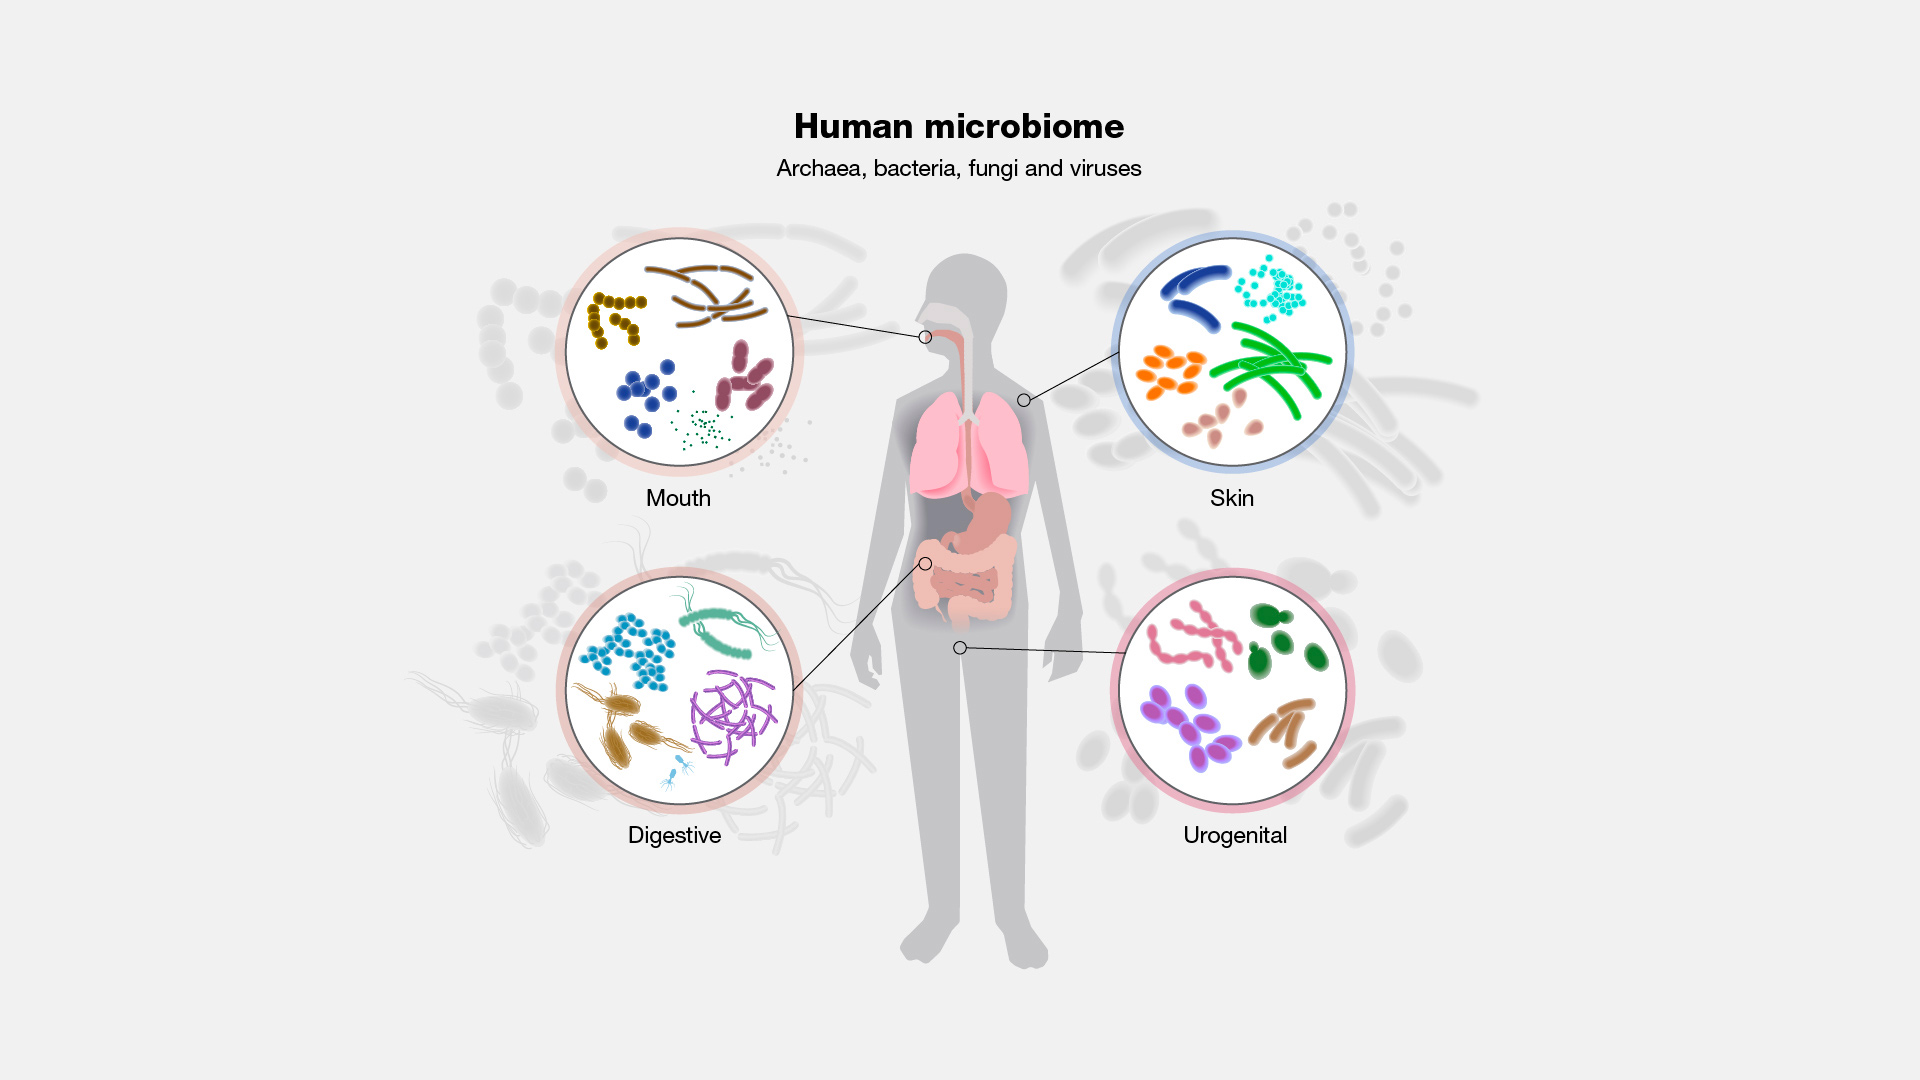
The gut microbiome is the most well-studied example but there is also a specific microbiome on the skin, in the lungs, the oral cavity, and elsewhere. Importantly, these communities are not static, they shift in response to diet, medication, exercise, and other environmental exposures that their host – the human – is subjected to.
But these microorganisms are not passive tenants. They are metabolically active, meaning they constantly perform biochemical reactions, consuming substrates from our diet, and producing molecules that interact with our own biology. This is microbiome metabolism.
For example: gut bacteria can transform dietary fiber into short-chain fatty acids (acetate, propionate, and butyrate) through fermentation, a process involving a series of enzymatic reactions. In other words, the chia seeds or lentils that you eat nourish your gut bacteria, which in turn ferment them and produce short-chain fatty acids that benefit your health!
Beyond digestion, gut microbes also synthesize vitamins, transform bile acids, metabolize drugs, produce neurotransmitter precursors, and generate gases like hydrogen sulfide (H₂S), the compound responsible for the characteristic rotten egg odor, which, as we'll see in this paper's case study, turns out to be a surprisingly rich window into microbiome metabolism.
Each of these outputs is the product of specific biochemical reactions, carried out by specific enzymes, encoded by specific genes, expressed under specific conditions. Most importantly, different microbes have different metabolic repertoires, which is why knowing which microbe does what, through which pathway, matters so much for understanding health and disease.
That is the main challenge of microbiome metabolism research and it is exactly the problem this paper takes a major step toward solving.
The Problem: A Hundreds of Thousands Models, Zero Maps
Over the past decade, constraint-based reconstruction and analysis ( COBRA ), has become one of the most powerful frameworks for studying how the microbiome interacts with human health. COBRA takes everything we know about a microorganism's genes and biochemistry, translate it as a mathematical model to simulate metabolism, predict flux through pathways, and generate mechanistic hypotheses.
The AGORA2 resource, published in 2023, gave us 7,302 strain-level genome-scale metabolic models (GEM) for human gut microbes. The APOLLO resource, published in 2025, pushed that to 247,092 models derived from metagenome-assembled genomes (MAG) spanning multiple continents, age groups, and body sites.
That is an almost incomprehensible amount of metabolic information. Yet, if you wanted to actually visualize what a given microbe can or cannot do metabolically, you were out of luck.
The Solution: Enter the MicroMap
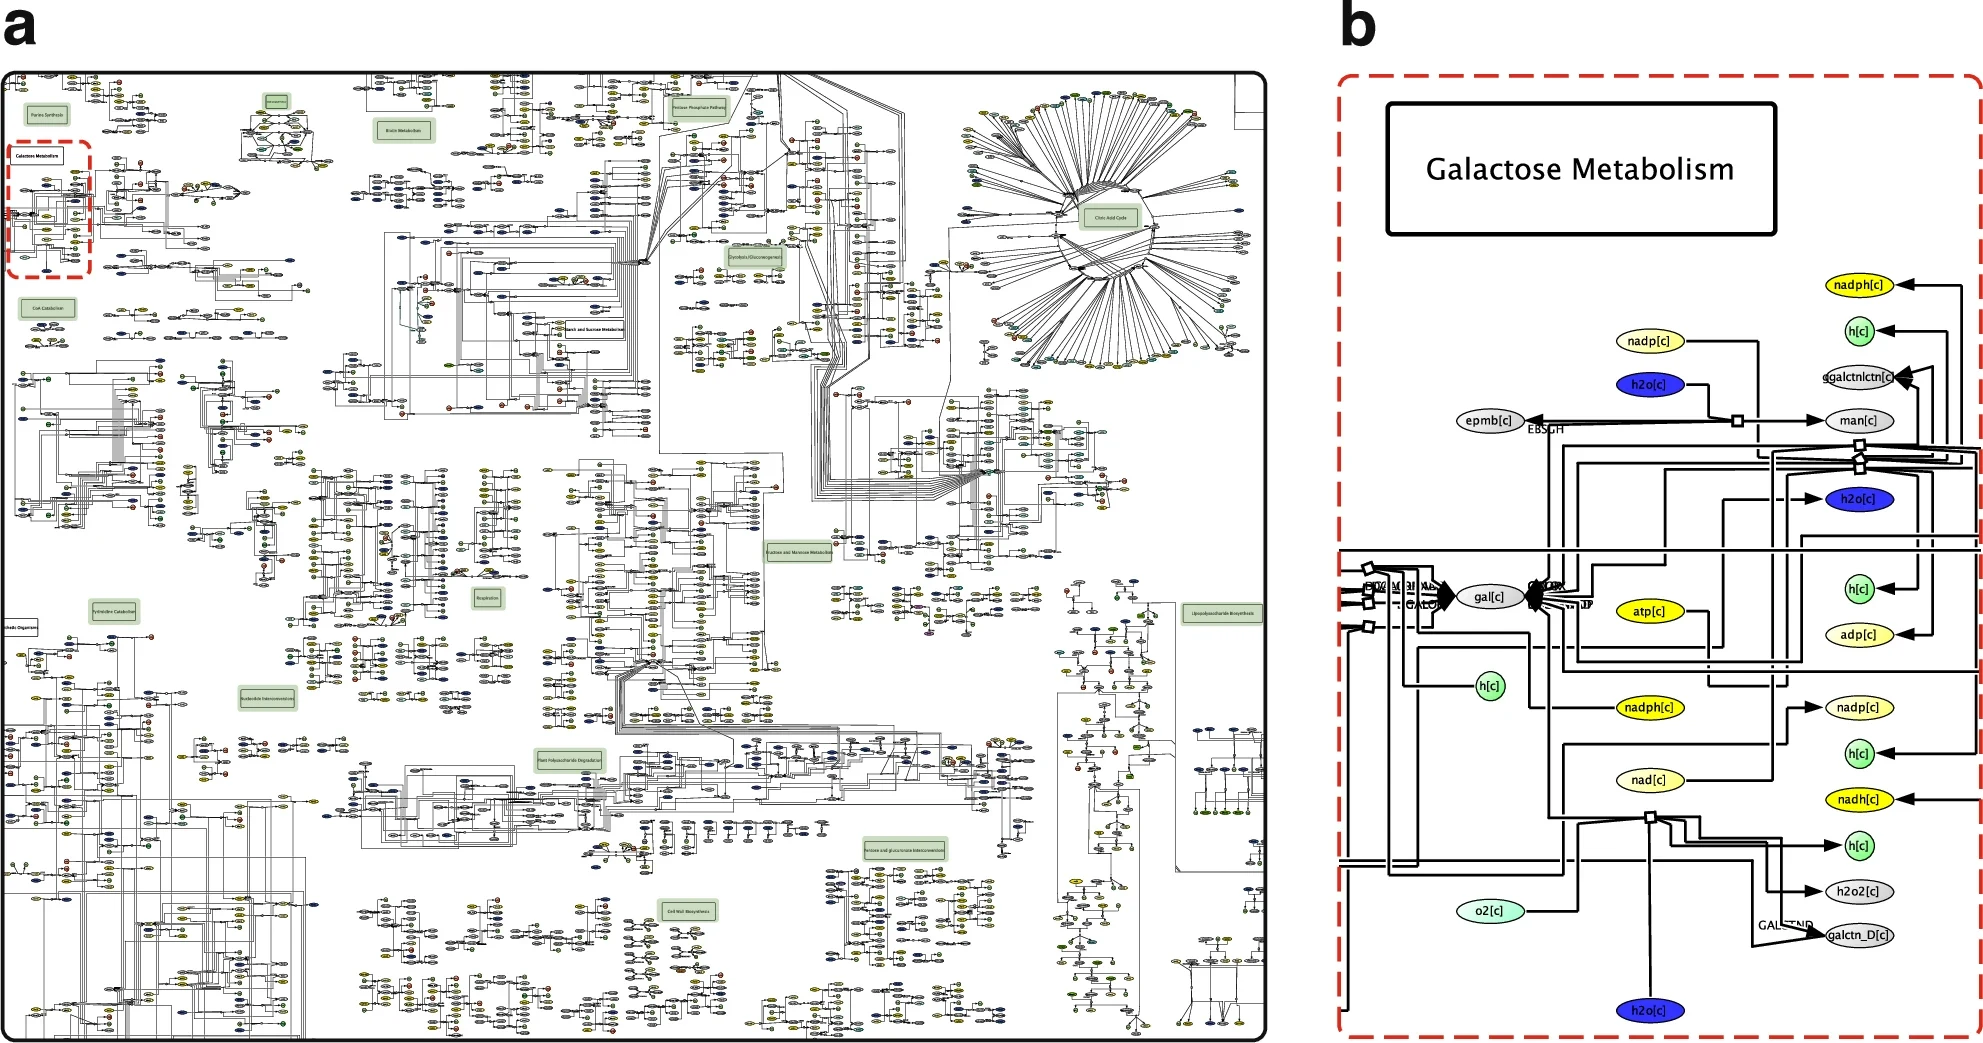
Thinnes et al. (2025) introduced the MicroMap in 2025. It is the first large-scale, manually curated metabolic network visualization for the human microbiome. Think of it as a metabolic city map: biochemical subsystems as neighborhoods, 337 location signs as landmarks, and consistent color coding to guide the eye (yellow for energy carriers like ATP and NAD, for example).
The MicroMap numbers are striking:
- 5,064 unique reactions, covering 59% of AGORA2 and 76% of APOLLO
- 3,499 unique metabolites, covering 97% of AGORA2 and 100% of APOLLO
- 98 drugs with their microbiome-mediated metabolism included
- 257,429 pre-generated microbe visualizations, freely available, covering every strain, species, genus, family, order, and class in both resources
One important thing before we go further: the MicroMap prioritizes biotransformation reactions and includes only a small subset of exchange and transport reactions. Those still exist in the full GEM and remain part of the modelling pipeline via the Microbiome Modelling Toolbox 2.0, but they won't appear on the map itself. Keep that in mind when interpreting visualizations.
What Can You Actually Do with the MicroMap?
1. Explore the metabolic landscape of any microbe
Open the MicroMap in CellDesigner (free, open-access software), overlay a reconstruction of your microbe of interest, and immediately see which reactions it can and cannot perform, within their full biochemical context, with upstream precursors and downstream products visible.
No table-reading required. No cross-referencing reaction lists. You just see it.
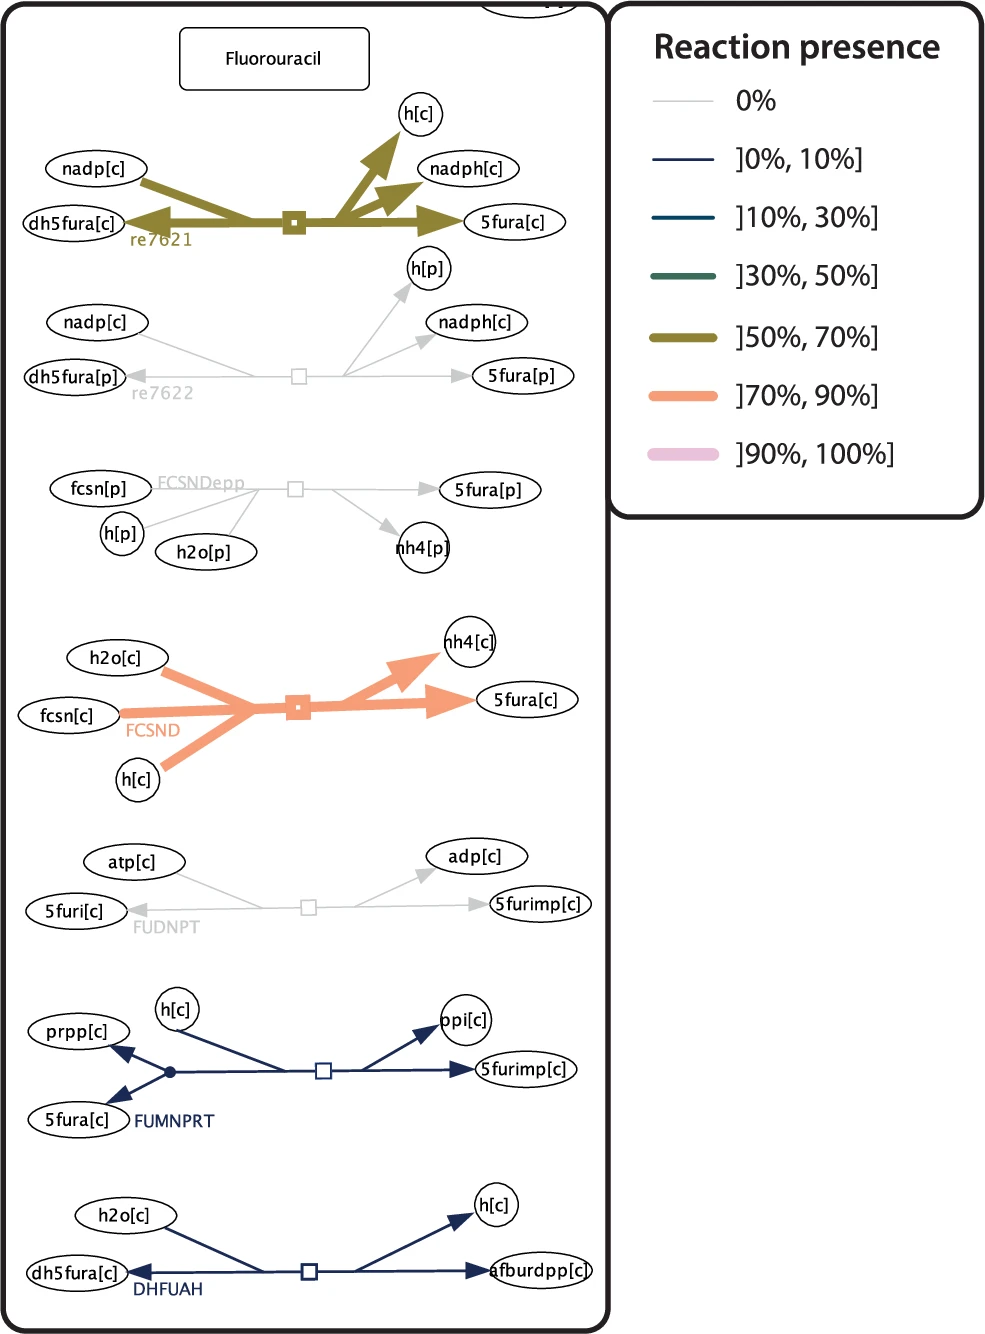
2. Compare metabolic properties across species with heatmaps
Thinnes et al. (2025) implemented a reaction presence heatmap function that lets you visualize relative metabolic properties across multiple reconstructions simultaneously. Color and line width both correspond to the proportion of species that carry a given reaction.
In which situation could these heatmaps be useful?
Before you ask: no, this heatmap won't predict the weather. The only things heating up here are metabolic reactions.
Thinnes et al. (2025) chose to compare the metabolism of 14 Pseudomonas species and 5-Fluorouracil (5-FU), one of the most used drugs in the world to treat cancer by chemotherapy. And of course, the gut microbiome has its part in it! It is well known that the gut microbiome modulates the 5-FU efficacy but also its toxicity. The heatmap revealed that while some Pseudomonas species can mediate known 5-FU biotransformation reactions, others cannot. This difference is now visible at a glance! This kind of insight, linking microbial taxonomy to drug metabolism, has direct clinical implications for understanding interindividual variability within patients in chemotherapy response.
3. Visualize flux balance analysis results directly on the map
This is arguably the most powerful feature for computational microbiome researchers.
After running a flux balance analysis (FBA) simulation in COBRA, you can now project the resulting flux vector directly onto the MicroMap. Reactions carrying flux are highlighted in red (positive) or blue (negative), with line width encoding magnitude. Reactions with no flux appear in grey. Thinnes, et al. (2025) go one step further: they implemented flux animation for longitudinal timeseries data. Each timepoint becomes a frame, and the resulting animation reveals how flux shifts, in direction and magnitude, as conditions change over time.
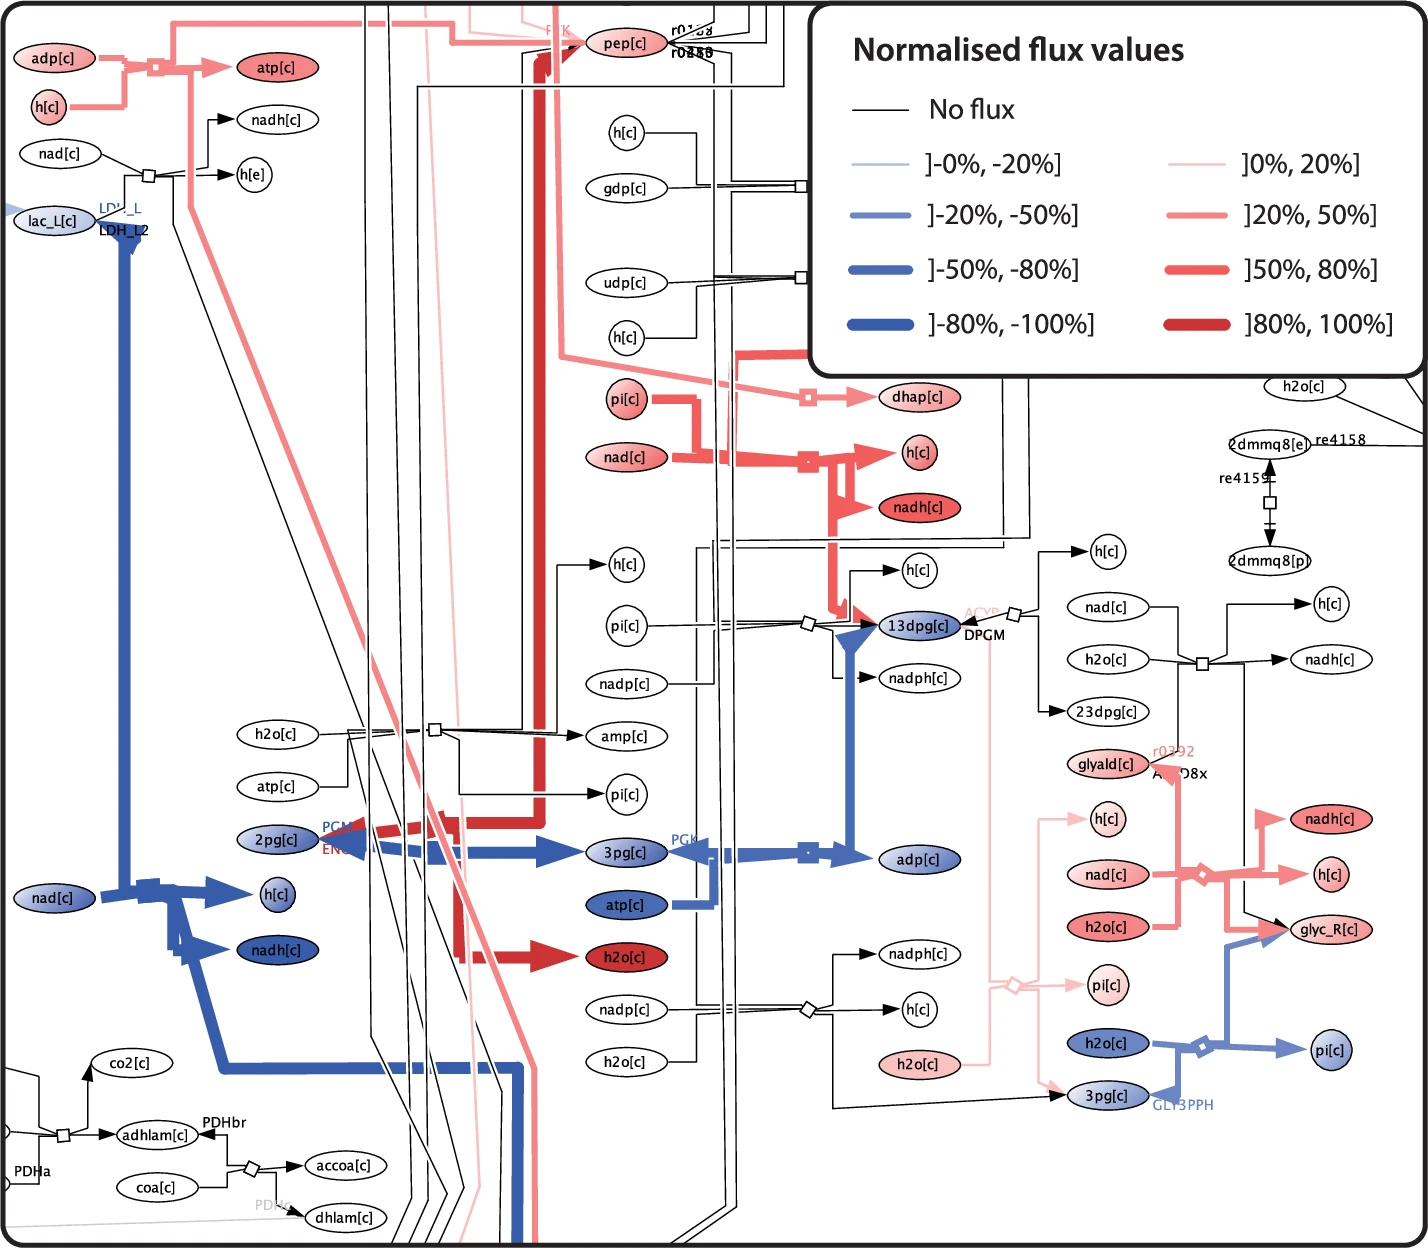
A word of caution from the authors themselves: a given flux vector may be one of multiple solutions to the underlying linear equations. Interpretation should always be informed by the specific COBRA methodology used.
The Case Study: Following the Smell of Rotten Eggs
Scent Trails: Tracking H₂S Production is a beautiful illustration of how this tool generates mechanistic hypotheses.
H₂S is a gut microbial metabolite with complex, context-dependent effects on host health. But a question is still pending: which microbes produce it, through which pathways, and how?
Using the MicroMap, Thinnes et al. (2025) found that H₂S metabolism is distributed across sulfur, methionine/cysteine, and serine metabolism subsystems, with multiple direct and indirect routes to H₂S formation. They identified a recurring H₂S ↔ SO₃²⁻ interconversion motif linking organic and inorganic sulfur pathways, a structural feature of the network that would be easy to miss when staring at reaction lists! Overlaying individual reconstructions revealed that Desulfovibrio desulfuricans has extensive H₂S metabolism, while Lactobacillus pasteurii has none. And when FBA was run without a direct cysteine source available, flux was rerouted through endogenous cysteine synthesis. This observation suggests that D. desulfuricans can produce cysteine internally under those conditions and highlights a pathway redundancy that might otherwise go unnoticed.
This might be one of the best ways to make hypotheses: mechanism-driven, visually guided, and immediately actionable.
A Roadmap for Your Own Research
Here is what this study means practically, depending on where you sit in the microbiome research landscape:
- If you do computational modelling (COBRA/FBA): The new MATLAB functions are
already in the COBRA Toolbox. You can start overlaying your own reconstructions and flux
results on the MicroMap today. Key functions:
visualizeReconstructionsOnMap.m,visualizeNormalizedRxnPresence.m,visualizeFluxFromFile.m. - If you study host-microbiome interactions or drug metabolism: 257,429 pre-generated visualizations are freely downloadable from the MicroMap dataverse. You don't need to run anything, just open the .xml file for your organism of interest in CellDesigner and start exploring!
- If you work on a specific metabolite or pathway: Use the MicroMap to contextualize it: find its precursors, its downstream products, the subsystems it connects to, and which microbes in AGORA2 or APOLLO carry the relevant reactions. This is the kind of systems-level context that is genuinely hard to reconstruct from pathway databases alone.
- If you are not a computational biologist: That is precisely the point. The authors designed the MicroMap to be accessible to wet-lab scientists, clinicians, and educators. The city-map layout, the color coding, the location signs, all of it is built to lower the barrier to entry.
The Bottom Line
The MicroMap does not generate new biological data. What it does is make existing visible and navigable for the first time. In a field where the gap between computational modelling and biological intuition remains wide, that is not a small thing. The map is free. The tools are open-source. The tutorial and case study are included. There is no good reason not to open it and discover this new city (and don’t worry, it’s certified H₂S smell-free).
Access the MicroMap
- All visualisations + tutorial: Dataverse
- COBRA Toolbox functions: COBRA github
- CellDesigner (free viewer/editor): CellDesigner
- VMH database: VMH Life
Related research project within SEEDBiomed network
V. M. Sheraton , S. Kumar , and T.-K. Ly aim to develop and validate mathematical models to numerically simulate the interplay between microbiome, lifestyle, culture and environment and their effects on oral and metabolic health during the first 1000 days of life.
This work is a part of the MetaHealth project, funded by the Dutch National Research Agenda Research along Routes by Consortia (NWA-ORC) call.
You can follow the MetaHealth work here: MetaHealth publications